In a nutshell
- Sound engineers manipulate sections of the sound frequency to improve the quality of a recording
- The low range of the audio spectrum ranges from 20Hz to 80Hz, while the mid and high ranges fall between 300Hz to 2KHz and 6KHz to 20KHzm, respectively
- In post graphics, EQs help polish the post-production mix
The audio spectrum describes the functional frequency range of sound. In theory, this does include all sounds in our hearing range and beyond. Understanding this range is important when recording audio for video.
Frequency ranges in the audio spectrum
We frequently hear EQ and frequencies referred to as low, mid and high. This convention has been propagated by virtually every audio and video equipment manufacturer over the last 50 years. Let’s add more meaning to these terms by attaching some numbers to them. The human hearing range is nominally between 20Hz and 20Khz, which sits in the mid range of the audio spectrum. Sensitivity at the high end tends to diminish with age.
Remember to protect your hearing by following good practices like using earplugs when necessary and taking hearing breaks. The OSHA recommended limit for the standard mixing volume of 85 dBA is eight hours. In practice, you should consider a break at least every four hours. Hearing fatigue reduces your hearing’s accuracy and will impact the quality of your mixing. Think of missing the forest for the trees in sonic terms.
Lows
The 20Hz to 80Hz range of the audio spectrum is the realm of subwoofers, for example, a kick drum’s punch. The 80Hz to 300Hz range introduces more tonality. The very bottom of the Tenor and Soprano ranges starts here. Be careful when cutting or boosting in this range as it is quite easy to lose or muddy subtle characteristics. What sounded punchy might be a muddy wash on another system.
Our article on monitoring sound in post goes into more detail on speaker placement and calibration to ensure greater accuracy in your mixes.
Mids
The mid range of the audio spectrum starts at 300Hz and extends to 2KHz. This is the domain of brass and woodwind instruments. The high-mid range extends from 2KHz to 6KHz. Our hearing is most sensitive to the mid range because that is where the bulk of the human voice sits. It is no surprise that our hearing has evolved around our need to communicate. This is also where the main element of the human voice and also where crunchy guitar tones come from. Boosting or cutting in this range can add or reduce nasal sounds as well accent a kick drum’s click.
Highs

Starting at 6KHz and all the way to 20KHz, the high frequency range of the audio spectrum is the realm of overtones and air. These are responsible for bringing out the complex sounds of an instrument, a room and even our voices. Another vocal quality that lives here is sibilance, the strong consonants responsible for producing harsh hissing sounds. The letter “s” is the most noticeable of the lot. Armed with this knowledge, you can easily use a notch filter to tamp down the offending frequency. There are also dedicated de-esser plugins, such as Logic Pro’s DeEsser.
EQ and filters
In the days before digital audio workstations, the required amount of electrical engineering know-how was significantly higher. Mixing desks and outboard gear were all complex and large analog circuits. Filters, gain stages and faders worked by altering the signal’s voltage and resistance. EQ pots are called that way because the dial being turned is a potentiometer (pot) that changes resistance.
Nowadays, we think of EQ in more aesthetic terms and what the audible impact sounds like and less about the theory in physics. This is a key point of divergence between the video and music worlds. Film and video still very much exist in the tactile and physical world. The art of live recording has been steadily migrating towards the digital world, with sounds and tones being designed and performed partially or exclusively through software.

Hi-pass/low cut
The keyword is pass, which means to allow. Hi-pass filters set a cutoff frequency; anything above is allowed to pass through, anything below is cut or reduced.
A hi-pass filter is also referred to as a low cut filter depending on the manufacturer.
You want to preserve as much bandwidth as possible. Cutting off frequencies below 120 or 80Hz reduces bandwidth costs by eliminating low-level sounds in that range.
Depending on the source material—take dialogue, for example—this is a good filter to enable even during outdoor recordings. A low cut filter does wonders to reduce rumble and wind noise.
Low pass/hi cut
The hi cut filter uses a cutoff frequency to adjust which high frequencies to reduce. This filter is basically a low cut filter in reverse.
Parametric EQ
The workhorse of the EQ world and by far the most common type used in DAW’s. The spectrum is split into several ranges, with low and high cut filters on either end. This multi-band approach allows for precision and ease of use.

Filter types
The standard filter types on a parametric EQ are low cut, low shelf, bell, high shelf and high cut. These are listed in order of frequency.
Frequency
This is the target frequency range for the EQ band or the cutoff for low and high cut filters. Parametric EQ’s by default arrange the frequencies from low to high, you are free to slide and arrange these as you please.
Q or Resonance
Controls the bandwidth or range of the current EQ band, this can be visualized as the size of the EQ bell. See below for more on Q!
Gain
Use this to adjust the level of the EQ band. The gain is adjustable by band or at the EQ’s output stage.
Filter Slope
The slope angle determines how aggressive the high or low pass filter is and is measured in dB per octave (dB/Oct).
Graphic EQ
The most common variant is the 31 band graphic EQ. There are models with fewer bands, but the usage remains the same. A key difference between parametric and graphics equalizers are their designs, specifically the selectable filter types, gain, Q and frequency centers present on a parametric EQ.
The DBX 231s is great tool and entry to graphic EQ, especially for live sound applications!
Software Graphic EQ’s are also plentiful and come as standard with most DAW’s.
Graphics EQs have fixed frequency centers in the form of bands, typically a bank for each output channel, and with adjustable gain. The Q ratio is fixed at 1/3 octave. The filter band gain has an adjustable ±6 or ±12 dB switch.
In practice, graphic EQs see the most use in post-production and live sound by sitting on the main output bus. In post graphics, EQs help round off and polish the mix. Live sound has the engineer sweeping through each band by quickly boosting and then cutting a frequency. It is common to briefly boost a frequency band to the point of feedback because that quickly reveals any problematic ranges. The end result smooths out the frequency response and reduces the likelihood of unwanted feedback.


In this case a 12.5 dB boost at 750Hz.
Notch filters
Are you trying to track down a troublesome frequency? Then this is the tool for you!
Notch filters are selectable filter types but are also quick and easy to build. A notch filter is a narrow band, high Q, filter that can sweep across frequency ranges.
They are useful for tracking down offending and reducing sounds. Sweeping through frequencies also makes a cool sound!
Q, explained
A common function on equalizers, Q controls the range or bandwidth. Q represents the size of the frequency range’s bell curve. High Q results in a narrow range or smaller bell curve that covers a smaller frequency range. Low Q has a wider range and covers more frequencies.
Bandwidth
This is the total amount of sound that the main bus can handle. Think of it as the maximum flow rate that a pipe can handle. We cannot stress enough the importance of editing and EQ in a project when it comes to maximizing bandwidth utilization. All sounds consume some amount of bandwidth, even recorded silence! Lower frequencies carry more power and consume more bandwidth. Use a low cut filter to trim these out, especially if the sound source does not have a meaningful presence in that range.
The same technique can be applied to high frequencies, in particular, if the sound source does not have a meaningful harmonic presence in that range. This is also useful in reducing bleed between microphones in close proximity.
Frequency and mixing

Learning and developing an awareness of the frequency ranges that instruments and voices reside in is something that comes with time.
Developing this is skill is in your best interest and is a focal point of using the audio spectrum efficiently.
The chart illustrates the frequency ranges that many many common instruments and voice types reside in.
Use charts like this to train your hearing. This knowledge is key to making informed microphone and EQ decisions.
Tips and tricks
Use the right mic
Using the right tools when the situation calls for it gives you much better odds of a good result. Use directional microphones like cardioids to reject unwanted sounds.
Select a microphone that compliments the talent’s voice, don’t use something that exaggerates qualities to the point of distraction.
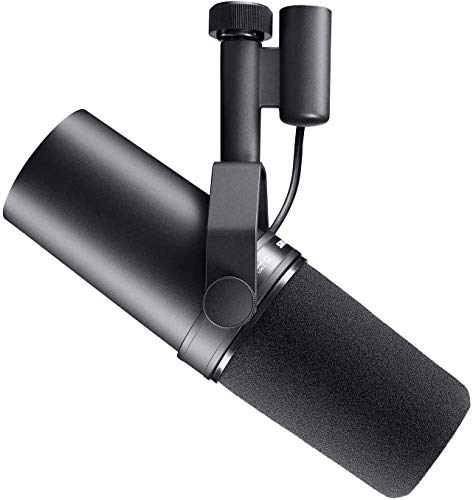
For example, the SM7B is a great voiceover microphone because of how it brings out the low mid in our voices. The adjustable frequency response makes it that much easier to use.
Cut first, boot second

Every mix starts off by having too much in it, but that’s also normal. The first steps are always to trim away the fat, in this case, unwanted or excessive frequencies. All the best practices in the world will not change this but will reduce the amount of work required.
Use the chart from earlier and EQ analysis tools present in most DAW’s to inspect and give more meaning to frequencies. You can now make informed decisions and start cutting frequencies that are not part of the source’s core range.
Happy mixing!
References
- EQ types
- https://iconcollective.edu/types-of-eq/
- OSHA occupational noise guidelines
- https://www.osha.gov/Publications/laboratory/OSHAfactsheet-laboratory-safety-noise.pdf
- SM7B response chart and image
- https://pubs.shure.com/guide/SM7B/en-US
- https://d2dfnis7z3ac76.cloudfront.net/shure_product_db/product_images/files/e05/77f/cc-/header_transparent/d8a05cd2b4d977f58caf81dc553dbfb4.png
- Instrument frequency chart
- https://www.shure.com/pt-BR/shows-e-producoes/louder/how-to-read-a-microphone-frequency-response-chart
- DBX 231s graphic EQ image
- https://adn.harmanpro.com/product_attachments/product_attachments/641_1412965838/231s_Front_Large_original.jpg


